Data-driven. Iterative. Awesome.

If you’re a member of staff at the University you will soon be hearing loads more about the Directory, the planned replacement for the University’s phone search system and staff profiles.

Whilst the Directory itself is rather cool, how it’s been built is of somewhat more interest. First of all, it’s driven entirely by data from other sources. The Directory itself doesn’t store any data at all, save for a search index. This means that unlike the old staff profiles on the corporate website it helps to expose bad data where it exists — since we soft-launched the Directory we’ve been barraged by requests from people to ‘fix their profile’, when in fact the thing that needs ‘fixing’ often lies at a far higher level. In some cases it’s literally been a case of people having misspelt job titles in the University’s HR system for years, data which is now corrected. This whole cycle of exposing bad data and not attempting to automatically or manually patch it up at the Directory end helps lead the University to have better data as a whole, making lives easier and people happier.

Secondly, the Directory is a perfect example of why iterative development rocks. The very first version of the Directory arrived over a year ago, and since then has been improved to include semantic markup, a new look, faster searching, staff profiles, more data sources, open data output formats and more. Over the last couple of weeks as it’s started to be integrated with the corporate website it’s been subject to even more refining, fixing formatting, typos, incorrect data and more. These changes happen quickly – a new version is released with minor changes almost daily – and are driven almost exclusively by real users getting in touch and telling us what they think needs doing.

The upshot of doing things this way, harnessing data that already exists and letting people feed back as quickly as possible, leads to products and services which reach a usable state far faster, are a closer match to user requirements, and help to improve other systems which are connected or exist in the same data ecosystem.

Told you it was awesome.

All About You

As you’ll know if you follow the adventures of Alex and myself we’ve been playing around with our new-look staff directory (give the beta a whirl). We’ve rebuilt it from the ground up to be stupidly fast, using bleeding-edge search technology all wrapped in Web 2.0 goodness to deliver your search results as quickly as possible. After all, why would you want to hang around waiting for half a second when we can have the number you’re looking for in a quarter of that time?

Directory search is awesome, but we thought we could do more with this information. We could take a person’s staff directory entry and make it a little bit more epic, as well as a bit more useful on the internet as a whole. So we did, and we’re happy to introduce the (beta) of staff profile pages – for examples see mine, Alex’s, Joss’s and Paul’s.

Continue reading “All About You”

The Re-Architecting of Jerome

Over the past few days I’ve been doing some serious brain work about Jerome and how we best build our API layer to make it simultaneously awesomely cool and insanely fast whilst maintaining flexibility and clarity. Here’s the outcome.

To start with, we’re merging a wide variety of individual tables ((Strictly speaking Mongo calls them Collections, but I’ll stick with tables for clarity)) – one for each type of resource offered – into a single table which handles multiple resource types. We’ve opted to use all the fields in the RIS format as our ‘basic information’ fields, although obviously each individual resource type can extend this with their own data if necessary. This has a few benefits; first of all we can interface with our data easier than before without needing to write type-specific code which translates things back to our standardised search set. As a byproduct of this we can optimise our search algorithms even further, making it far more accurate and following generally accepted algorithms for this sort of thing. Of course, you’ll still be able to fine-tune how we search in the Mixing Deck.

To make this even easier to interface with from an admin side, we’ll be strapping some APIs (hooray!) on to this which support the addition, modification and removal of resources programmatically. What this means is that potentially anybody who has a resource collection they want to expose through Jerome can do, they just need to make sure their collection is registered to prevent people flooding it with nonsense that isn’t ‘approved’ as a resource. Things like the DIVERSE research project can now not only pull Jerome resource data into their interface, but also push into our discovery tool and harness Jerome’s recommendation tools. Which brings me neatly on to the next point.

Recommendation is something we want to get absolutely right in Jerome. The amount of information out there is simply staggering. Jerome already handles nearly 300,000 individual items and we want to expand that to way more by using data from more sources such as journal table of contents. Finding what you’re actually after in this can be like the proverbial needle in a haystack, and straight search can only find so much. To explore a subject further we need some form of recommendation and ‘similar item engine. What we’re using is an approach with a variety of angles.

At a basic level Jerome runs term extraction on any available textual content to gather a set of terms which describe the content, very similar to what you’ll know as tags. These are generated automatically from titles, synopses, abstracts and any available full text. We can then use the intersection of terms across multiple works to find and rank similar items based on how many of these terms are shared. This gives us a very simple “items like this” set of results for any item, with the advantage that it’ll work across all our collections. In other words, we can find useful journal articles based on a book, or suggest a paper in the repository which is on a similar subject to an article you’re looking for.

We then also have a second layer very similar to Amazon’s “people who bought this also bought…”, where we look over the history of users who used a specific resource to find common resources. These are then added to the mix and the rankings are tweaked accordingly, providing a human twist to the similar items by suppressing results which initially seem similar but which in actuality don’t have much in common at a content level, and pushing results which are related but which don’t have enough terms extracted for Jerome to infer this (for example books which only have a title and for which we can’t get a summary) up to where a user will find them easier.

Third of all in recommendation there’s the “people on your course also used” element, which is an attempt to make a third pass at fine-tuning the recommendation using data we have available on which course you’re studying or which department you’re in. This is very similar to the “used this also used” recommendation, but operating at a higher level. We analyse the borrowing patterns of an entire department or course to extract both titles and semantic terms which prove popular, and then boost these titles and terms in any recommendation results set. By only using this as a ‘booster’ in most cases it prevents recommendation sets from being populated with every book ever borrowed whilst at the same time providing a more relevant response.

So, that’s how we recommend items. APIs for this will abound, allowing external resource providers to register ‘uses’ of a resource with us for purposes of recommendation. We’re not done yet though, recommendation has another use!

As we have historical usage data for both individuals and courses, we can throw this into the mix for searching by using semantic terms to actively move results up or down (but never remove them) based on the tags which both the current user and similar users have actually found useful in the past. This means that (as an example) a computing student searching for the author name “J Bloggs” would have “Software Design by Joe Bloggs” boosted above “18th Century Needlework by Jessie Bloggs”, despite there being nothing else in the search term to make this distinction. As a final bit of epic coolness, Jerome will sport a “Recommended for You” section where we use all the recommendation systems at our disposal to find items which other similar users have found useful, as well as which share themes with items borrowed by the individual user.

Delicious tea…

Everybody loves cups of tea (or, if you prefer, coffee). Boiling the kettle to make those cups of caffeinated goodness takes energy, something which we’re constantly trying to use less of. Which is why when I discovered some of the University’s energy data I knew what had to be done.
You can now take a look at the electricity consumption of various University buildings expressed as how many cups of tea you could make with the same amount of energy. There’s even a pretty graph which shows how energy use fluctuates over the last 24 hours.

Open data is good – it lets us throw things like this together in a matter of minutes rather than hours.

Student as Producer, meet Nucleus

I’ve not done a theoretical, academic(ish) blog post for a while, choosing instead to focus on the more technical sides of what I’m doing. However, that doesn’t mean that what we’ve been doing is driven purely by the technology.

What I’m talking about in this blog post is our Nucleus platform – a collection of data stores, APIs and authentication mechanisms which, when put together, allows anybody within the University to interact with data in exciting new ways. Of particular interest is how Nucleus meshes with Student as Producer, our new institution-wide pedagogy. Put simply, Student as Producer is all about empowering students to become part of the production and provision of teaching and learning, rather than just consumers. Students are involved in research, course creation and much more on the academic side. It’s already seen some awesome results, and it’s becoming a massive part of how Lincoln does business.

So, how does Nucleus fit in? The answer lies in the potential to unlock the University’s inner workings for Students to mash up as they like. At the moment if the University doesn’t offer a service, students can’t do anything about it. Want a way to automatically renew books if nobody else has requested them? Nah, can’t do that. Want to mash up room availability with your classmates timetables to find a perfect study session and a room to put it in? Tough.

Understandably, as a former student, this isn’t good enough. So part of our Nucleus platform is trying to open as much of this data and functionality as we can up to anybody who wants to have a go. Obviously it’s still held within an appropriate security framework, but we believe that if a student can come up with a better (or different) way of doing something, they should be encouraged every step of the way.

We’ve got some really exciting stuff coming down the pipeline to help us offer support and resources to students (and staff) who want to explore the possibilities. Stay tuned!

Information Everywhere

In the past few weeks I’ve been dabbling (in between my ‘real’ projects of Jerome and Linking You) with the concept of ‘dashboard’ displays and information radiators. For those of you unfamiliar with the concept they are fundamentally a place which presents information in an easy to digest format. Some are pinboards, some are whiteboards, some are clothes lines with bits of paper pegged to them and some are displays or projectors.

What I’ve opted for is the display method, in no small way inspired by the guys at Panic. However, since between ICT we have what is generally referred to as a metric shedload of information that we want to get hold of I decided that instead of crafting a display for each individual group’s specific needs I would instead come up with a sexy looking framework for rapidly building dashboards. These are designed to live on large screens dotted around the office, visible all day to anybody who happens to look at them.

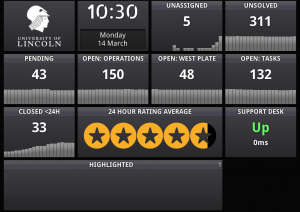
There’s already an example in use at the Service Desk, where a trusty old iMac is proudly displaying various stats from Zendesk (our ticket manager) to the support team. Initial feedback is that people really like being able to get an overview of what’s going on in one place, as well as any urgent jobs and their feedback averages.

Down in the depths of OST, on the other hand, we’re not massively bothered about our ticket stats in such an immediate manner. Instead we’re far more interested in things like our server availability, response time and load. This means that the modules on our dashboard currently pull data from our Nagios monitoring tool, informing us with the red alert klaxon from Star Trek if things go horribly wrong (causing much turning of heads towards the board to see what’s happened, and everyone else in ICT looking at us in confusion).

Hopefully as time goes on more people will find data which can be represented using these boards, meaning that they will start popping up in more places and exposing data which lets us make faster, smarter decisions about what we’re doing. I’ve already started working on a dashboard for getting the data from the agile development tracker that Alex and I use into a really easily digested format, and I’ll be talking to the Projects team to find out exactly what they want to see with regards to more overarching project management.

Easier? I think so.

It’s Time for Support Zen

It is with great and unreserved pleasure that I announce the grand opening of one of ICT’s latest projects, which has been occupying a surprisingly large amount of my time over the last two months and which has led to me wrapping my head around some quite interesting bits of JavaScript.

Zendesk is here. Or, as we prefer to call it, the Support Desk. It’s a one-stop shop for all your ICT and Estates queries and requests, managed by our crack group of support agents and backed by the combined centuries of knowledge and experience offered by the ICT and Estates teams.
It’s been an interesting journey thought the backwaters of the University’s policies and processes, a less than enjoyable romp through bits of law which I didn’t even know existed, and an exhilarating codathon whilst I wrapped my head around slinging JSON across the ether and inserting it into some HTML elements which don’t exist on a page I don’t control using nothing more than a well-crafted bit of JavaScript and a paperclip. All that is behind us now, so it’s time to tell you what’s new and awesome in the world of getting ICT and Estates support at Lincoln.

First of all, we’ve taken the best bits from both, ditched the worst bits and then streamlined the whole process. From the moment you call or email your request it’s placed directly into Zendesk from where we can monitor how it’s doing. Even better, why not submit your query online using our new request form, now with even fewer annoying questions which you don’t know the answer to than before. It’s a simple matter to sign in using your normal University details and skip the whole process of telling us your name, email address, room code, phone number, line manager, inside leg measurement and what you had for lunch yesterday.

As soon as your request is logged you’ll get a request tracking number within seconds, followed up by emails every time we update your request with something you need to know. You’ll never be out of the loop again, and you can even go online and check all your requests to see how we’re getting on. Leave comments, upload files, tell us that it’s solved and more all from right within your browser.

We could have left it there, but we weren’t done. It only took a few minutes of looking to realise that our how-to guides, instruction manuals, FAQs and more were scattered hopelessly around the Portal, Blackboard, paper help sheets, PDF files, student guides, posters and more. This wasn’t good enough, so we decided to bring them all together into Quick Answers. It’s the place to find solutions to your problems both common and esoteric, guides to walk you through getting things done, information on what’s going on and all kinds of other things. Just type your question or a few key words into the search box and see what we can tell you. Think something’s missing? Just drop me an email and we’ll get it added.

At the end of Phase 1 we’re really excited about the changes and we hope that they make everyones lives a lot easier, as well as helping you to get your problems solved faster than before. Support Desk: now open.

Who are you?

Today I’ve mostly been working on the magic of our user data collector for Nucleus, an awesome bit of technology which takes our slightly slow existing method of finding user information and replacing it with one blisteringly fast one based on our ever-favourite database Mongo.

What it does is – on a regular schedule – go through the entire directory letter by letter, collect all the users, and write their details to the database. How it does this, however, is a bit smarter than a bulk import in that it actually looks to see if the user has been updated or not, and records the changes. We can then use this data to do ‘push’ updates of user information – telling services which rely on user data that something has changed as soon as we can, rather than waiting for those services to have to look for changes themselves. We can also let those services do a ‘changes pull’, asking only for those records which have changed since a particular time. All of this combines to reduce network overhead and speed up processing by only sending changed details around, rather than a massive dump of all our data.

Coming soon to Nucleus will also be the first bit of cross-service collation as we begin to include data from students such as addresses and home email addresses. Where in the past this would require querying four different services, receiving a mix of data types and needing a lot of massaging to do anything useful we’ve done the hard bit for you. Even better, instead of giving insecure access to the data by providing direct database access, or blindly dumping the information, access will be controlled using the power of OAuth, giving us fine-grained control over exactly who can see what.

The Dashboards Are Coming!

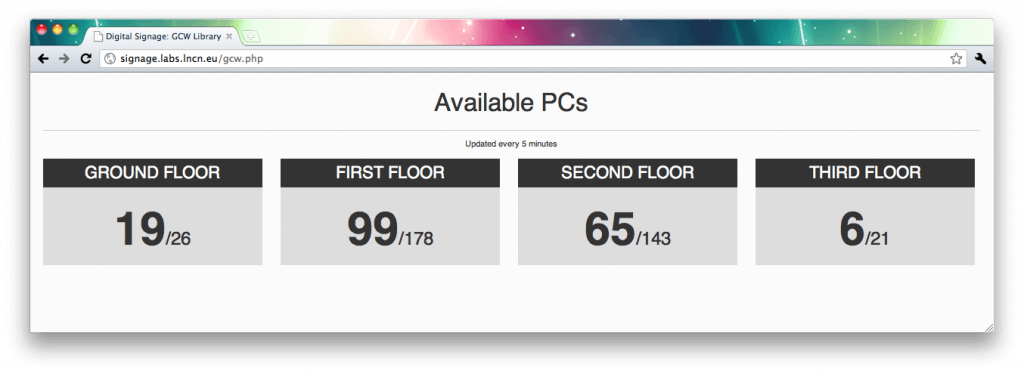
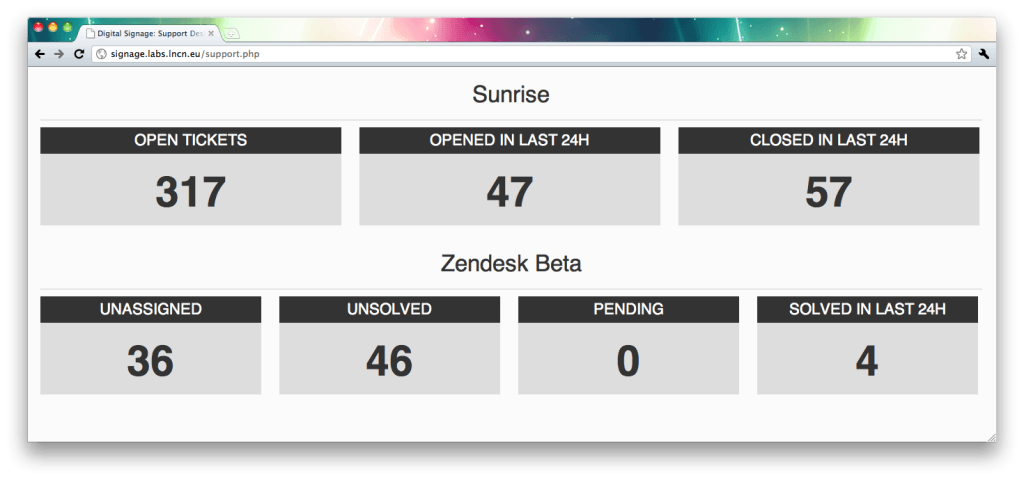
Hot on the heels of my ability to extract key information from Zendesk, I’m pleased to announce that we now have two new bits of data available for people to digest. The first one is a set of numbers from our current service desk software, which will (hopefully) be appearing in the ICT service desk sometime in the next week whilst we try hammer through some old tickets.

The next, more usefully for everyone on the academic side, is a summary display of PC availability in the GCW. There’s a bit of worry that the numbers may not be 100% accurate, but we’ve got a hardware audit planned so hopefully by the 24/5 opening these stats will be shockingly accurate, and possibly arranged into zones so you can find a free seat even easier.

Enjoy!