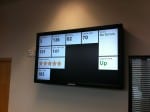
Useful numbers on our wall!

After a lengthy run-up, our Panic-inspired status boards are partially here! We have two Samsung 460MX-3 displays (one for each of our two offices), kitted out with the Network module which gives them an embedded system we can control remotely.

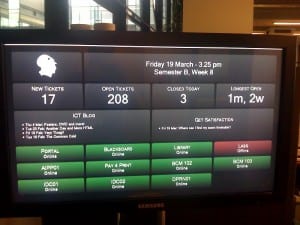
We’re currently viewing a custom web page – one for each office – displaying some key stats from our ticketing system. This is only a first step though, we’ll be developing the status boards to tell people what they need to know, be that how servers are performing, how many tickets they’ve got open or how much traffic is flowing through a given website.

And now, photos!
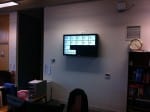
Keeping an eye on things

A very early version of one of the Status Dashboards. The numbers aren't live (or accurate), but everything else is actual real-time information.

If you’re kicking around the north-west ICT Services office you may have spotted the giant touchscreen which has appeared. This is nothing to do with me, however with it sat being idle I decided to act on some inspiration from the people at Panic and build something ICT doesn’t currently have – a live, up-to-the-minute status and monitoring system.

The Status system (To be hosted on Labs, whenever the server arrives. You will note that it’s currently offline.) is fully modular (each individual panel can behave in its own way, making its own checks and loading its own data on its own schedule, customisable (so different ‘dashboards’ can be created to serve particular needs) and flexible (it makes the best use of screen estate that it can, without relying on a fixed display resolution). It also looks quite good.